Project of Bojack Horseman
By Savannah
The Visualization
After Milo has completed the scrapping and auto tagging of all the text script, I then take the scripts and import them to eXist-db to xQuery them. I used xQuery to help separate and list out pieces of information that are deemed useful. In this example, I’ve deemed all pieces of text that are surrounded by music notes to be pulled and listed alongside the season it appeared in. Dr. Beshero-Bondar and I collaborated on this xQuery to get the song lyrics since for-loops are not my strong suit. I did, however, learn from that collaboration and created another xQuery to section the music into episodes. In the figure below is part of the output I got after xQuery:
Music: ♪ got a heart full of birthday-- ♪ Season Count: 1 S:6
 Music:
                        ♪ bye ♪ Season Count: 1 S:6
 Music: ♪ who's that dog? ♪ Season Count: 2
                        S:6
 Music: ♪ who's that dog? ♪ Season Count: 1 S:1
 Music: ♪
                        who's that dog? ♪ Season Count: 1 S:3
 Music: ♪ who's that dog? ♪
                        Season Count: 1 S:4
 Music: ♪ mr. peanutbutter ♪ Season Count: 2
                        S:6
 Music: ♪ mr. peanutbutter ♪ Season Count: 1 S:1
 Music: ♪ mr.
                        peanutbutter ♪ Season Count: 1 S:3
 Music: ♪ and you think you're never
                        wrong ♪ Season Count: 1 S:6
 Music: ♪ oh, but you're so-so, honey ♪
                        Season Count: 1 S:6
 Music: ♪ oh, yeah, you're so-so, honey ♪ Season
                        Count: 1 S:6
 Music: ♪ you think you got it all ♪ Season Count: 1
                        S:6
 Music: ♪ if i knew i waited too long ♪ Season Count: 1 S:6

                        Music: ♪ i'd find a song to push the time along ♪ Season Count: 1 S:6
I then took that output and imported it into CytoScape to visualize the data. CytoScape is good with networking and can network large amounts of data at once. For this example, I set the lyrics to be connected to each season it appeared in. I also have it set to have the connecting lines to have a growing width based on how repetitive it is per season, same with its color gradient. Below is the Music Network in Seasons, you can zoom and move elements around below:
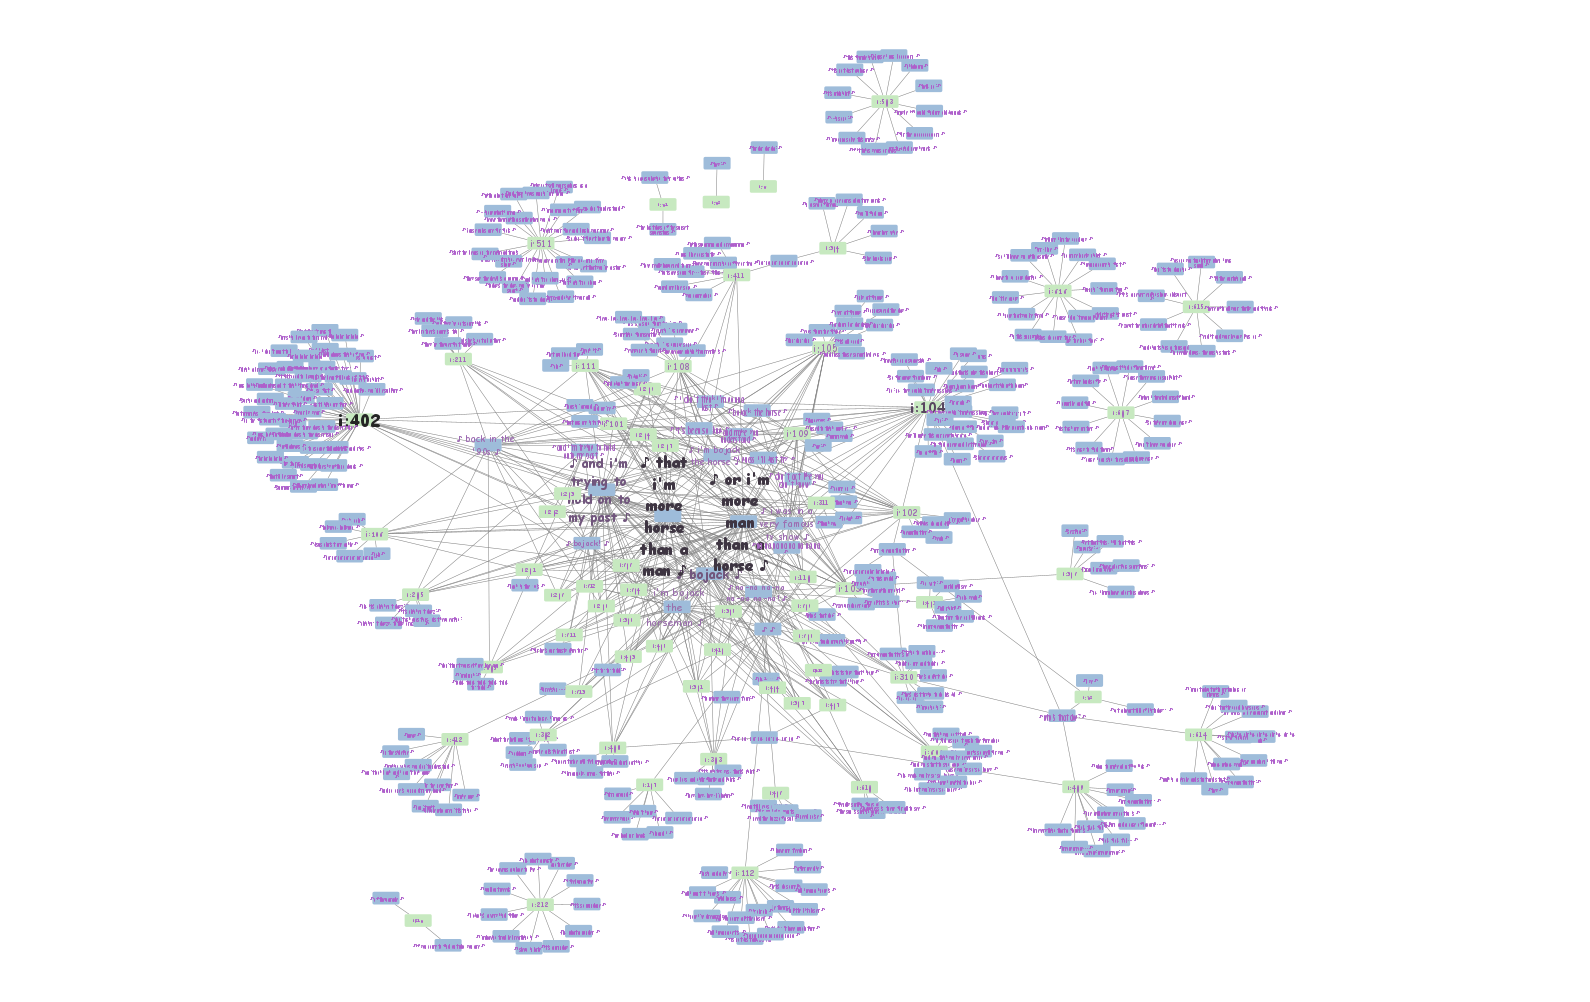
I used the same xQuery process from making the seasons network to make the episodes network. Here is the xQuery Output I got along with the Music Network in Seasons. Be sure to click the Music Network in Episodes picture to see the full network in action.
Music: ♪ got a heart full of birthday-- ♪ id Count: 1 i:602
 Music: ♪
                        bye ♪ id Count: 1 i:602
 Music: ♪ who's that dog? ♪ id Count: 1
                        i:614
 Music: ♪ who's that dog? ♪ id Count: 1 i:104
 Music: ♪
                        who's that dog? ♪ id Count: 1 i:310
 Music: ♪ who's that dog? ♪ id
                        Count: 1 i:409
 Music: ♪ who's that dog? ♪ id Count: 1 i:602

                        Music: ♪ mr. peanutbutter ♪ id Count: 1 i:609
 Music: ♪ mr.
                        peanutbutter ♪ id Count: 1 i:104
 Music: ♪ mr. peanutbutter ♪ id Count:
                        1 i:310
 Music: ♪ mr. peanutbutter ♪ id Count: 1 i:602
 Music: ♪
                        and you think you're never wrong ♪ id Count: 1 i:601
 Music: ♪ oh, but
                        you're so-so, honey ♪ id Count: 1 i:601
 Music: ♪ oh, yeah, you're
                        so-so, honey ♪ id Count: 1 i:601
 Music: ♪ you think you got it all ♪
                        id Count: 1 i:601
 Music: ♪ if i knew i waited too long ♪ id Count: 1
                        i:601
 Music: ♪ i'd find a song to push the time along ♪ id Count: 1
                        i:601
 Music: ♪ change works so well for you ♪ id Count: 1 i:601

                        Music: ♪ 'cause you're so-so, honey ♪ id Count: 1 i:601
 Music: ♪ and
                        you start to sing along ♪ id Count: 1 i:601
Limitations
There was quite a bit of limitations to this project unfortunately. Like Milo said, Netflix is very vague with providing scripts to the public and couldn’t fine a script that provided who was talking. So that effected the auto tagging and now it effects the Visualization.
There weren’t many directions to go when it came done to networking, so I chose to network what would be the easiest to query, and that was the music lyrics. Most songs had this little song note symbol around each line which was easy fine via xQuery. The next thing that didn’t help was that if I wanted to start xQuerying the auto tagged scripts and find an inconsistency in the tagging that could greatly impact the network, I’d have to stop, let Milo know of the situation, have him go back to python and fix such inconsistency, and load out a new set of auto tagged scripts for me to use instead. This was such an annoyance since everything leading up to the Visualization is all based on the initial Python auto tagging. So if we wanted an accurate network, we’d have to rely that the Python has worked the best as it could or else the whole visualization network will start over